
Chapter 2 - Day 10 - Lesson 2.8
Chapter 2
Day 1
Day 2
Day 3
Day 4
Day 5
Day 6
Day 7
Day 8
Day 9
Day 10
Day 11
Day 12
Day 13
Day 14
All Chapters
Learning Targets
-
Use technology to calculate quadratic models for curved relationships, then calculate and interpret residuals using the model.
-
Use technology to calculate exponential models for curved relationships, then calculate and interpret residuals using the model.
-
Use residual plots to determine the most appropriate model.
Activity: Who Can Get The Closest To The Finish Line?
Activity:


Answer Key:
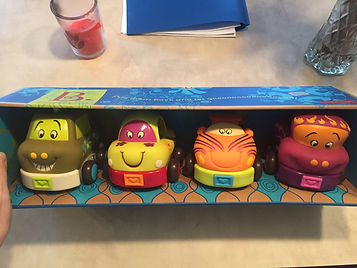
We modified an activity from Fawn Nguyen for this lesson. Students will be using the kids cars that wind up when you pull them back. At the end of the lesson, each group will bring their car to the racing line and try to get it as close as they can (without going over) to the finish line.
The first data points in the Activity are for pulling back the cars 2 inches. We found that some of the cars wouldn’t even move with a pull back of 2 inches. So we think maybe starting at 4 inches and going up from there. The Activity could also be modified by removing the pull back distances and having students create their own values.
Each group collected data with their own car and then used the Applet to find the best model (linear, quadratic, or exponential). Most groups settled on quadratic, with only a few using exponential. Once all the groups had finished choosing a model, the race distance was announced: 100 inches. Students then had to use their model to make a predicted pull back distance that would propel the car 100 inches (but not over). The quadratic formula is necessary here or students can simply guess and check with x-values. Some of our groups got very close to the finish line.
After some reflection, we think that starting the lesson by telling students about the goals for the end race will help them to see the value in picking the best model (to make the best predictions!). We are trying to promote more natural curiosity out of our students (like Dan Meyer).


Notes
Encourage students to look at residual plots, the standard deviation of the residuals (s), and the coefficient of determination (r2) when choosing the best model. We want no leftover pattern in the residual plot, the lowest standard deviation of the residuals and a coefficient of determination as close to 1 as possible.