
Assessing a Regression Model
Chapter 2 - Day 9 - Lesson 2.7
Activity: How Many iPhones Will Sell?
Activity:


Answer Key:
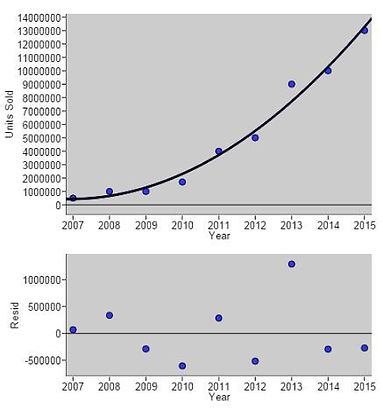
For this Activity, we took some data from a Yummymath activity because we wanted something relevant and non-linear. Students quickly recognized the data as nonlinear. They tried fitting a line and then a quadratic. The quadratic model fit the data the best and it showed a residual plot with no leftover pattern.
We tried to relate s (standard deviation of the residuals) back to the scatterplot and the residual plot by recognizing that essentially s is telling us the average distance that each point is away from the model in the scatterplot or how far each residual is away from the x-axis. We like the use of “typically varies” in the interpretation in the text because it is consistent with the interpretation of standard deviation from Lesson 1.7 (after all, s is a standard deviation).
Notes
Students struggled with the interpretation of r² even after we looked at the discussion of the sum of squares in the text. We settled on a much simpler (and less statistically sound) version: “The LSRL improves our predictions for y by ____%”.
It is important that students use precise statistical language when trying to choose the best model for a set of data. All too often, students say “it is quadratic because it shows no pattern”. “it” is so vague and needs to be clarified by saying “the scatterplot of Iphone sales versus year is quadratic because the residual plot shows no pattern. Students should know the distinction between scatterplot and residual plot. We are trying to find a model for the scatterplot. The residual plot tells us whether or not our model is a good one.