
Sampling Distribution for a Difference
of Proportions
Chapter 10 - Day 1 - Lesson 10.1
Chapter 10
Day 1
Day 2
Day 3
Day 4
Day 5
Day 6
Day 7
Day 8
Day 9
Day 10
Day 11
Day 12
All Chapters
Learning Targets
-
Describe the shape, center, and variability of the sampling distribution for a difference of proportions.
Activity: Is Yawning Contagious?
Activity:


Answer Key:
Print off this Yawning Template and cut out the cards prior to class. Each pair of students will need a set of cards. Start class with a video, in which the Mythbusters conduct an experiment and conclude that yawning is contagious. As a whole class, draw an outline of the experimental design:
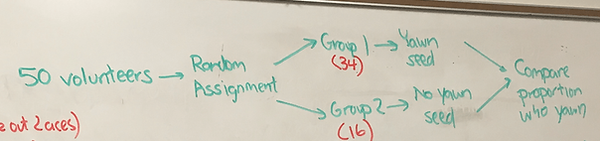
In the experiment, the percentage of people given the yawn seed that ended up yawning was 4% higher than the percentage of people not given the yawn see that ended up yawning. While this provides some evidence that yawning is contagious, does it provide convincing evidence? Students will use a simulation to find out. Assuming that yawning is not contagious, how likely is it to get a difference of proportions of 0.04 or higher. Students will shuffle the cards and randomly assign subjects to the two treatments, then find the difference of proportions that occurs purely by chance due to random assignment. The class will create a dotplot of the differences:

Use this applet to extend this simulation to many, many trials. In the end, students can estimate a P-value and realize that the difference of proportions of 0.04 could likely have occurred purely by chance due to the random assignment.
WE BUSTED THE MYTHBUSTERS!
What Does This Dot Represent?
In the debrief, point at one of the dots in the dotplot and ask “What does this dot represent?” The best answer is “A random assignment of the 50 subjects into two groups and a difference of proportions calculated from that random assignment”. Point to another dot and ask the same question. The answer is “A differentrandom assignment of the 50 subjects into two groups and a difference of proportions calculated from that random assignment”. So our dotplot represents many, many different random assignments of 50 subjects into two groups and a difference of proportions calculated for each random assignment.
Is This Really a Sampling Distribution?
Nope.
A sampling distribution shows the distribution of all the possible statistics based on many, many random samples (not many, many random assignments!). So technically this is not a sampling distribution — it is a randomization distribution. This distinction is not important for AP Statistics students and the reality is that the sampling distribution of the difference of proportions very closely models the randomization distribution of the difference of proportions.
Formulas for the Sampling Distribution
We use this document to lead students to describe the shape, center, and variability of the sampling distribution of the difference of proportions. They must connect it to the shape, center, and variability for the sampling distribution of a single proportion from Lesson 7.2. The common mistake here for students is to want to add (or worse to subtract) the standard deviation formulas. Remember that “one does not simply add standard deviations”. Instead, we add variances and then square root.
